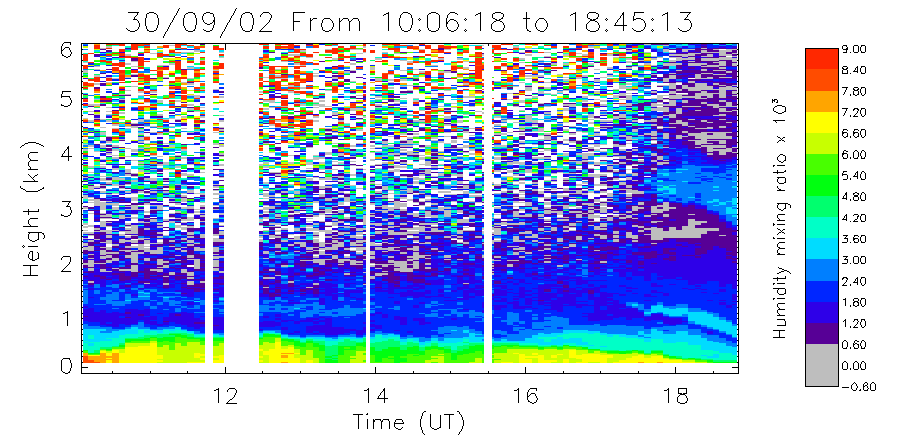
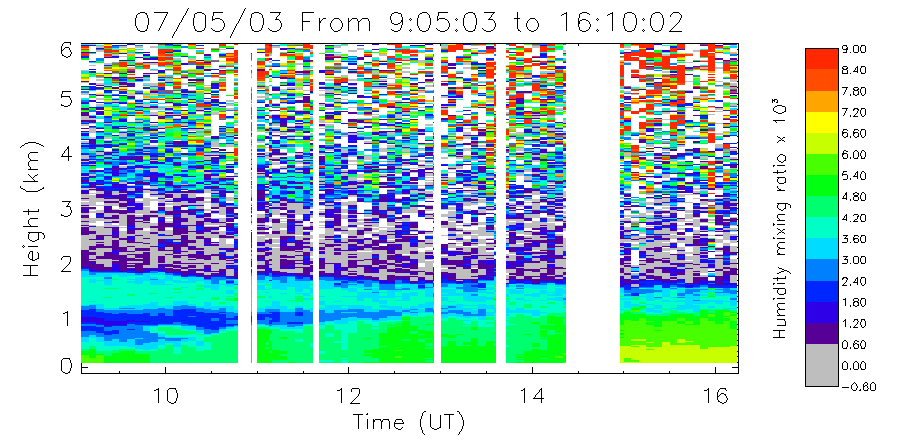
These plots show examples of the types of measurements that can be made with the Chilbolton UV Raman lidar. They were recorded on days that had interesting atmospheric conditions.
| 30th September 2002 | 7th May 2003 |
Water vapour mixing ratio
 |
 |
Modified radio refractivity gradient
.gif) |
 |
The uper two plots show water vapour mixing ratio measurements, recorded using the water vapour and nitrogen Raman scattering measurements. On 30 September 2002 measurements continued until after dark. The resulting reduction in the noise level (which results from solar radiation) is seen at altitudes greater than about 2 km towards the end of the plot. Both water vapour plots show a relatively complex variation in water vapour mixing ratio with height. On both days there was a low pressure system nearby and such conditions often produce interesting water vapour profiles.
The lower two plots show the gradient of the modified radio refractivity, derived from the water vapour mixing ratio data. The temperature and pressure profiles needed in the calculation were obtained from nearby radiosonde measurements. Where this gradient is less than zero it is possible for a radio duct to be formed. A negative gradient usually occurs as a result of a rapid decrease in water vapour mixing ratio with height. It results in the refraction of radio waves so that they can follow the curvature of the earth and be detected at locations far beyond their normal range. The extent of the duct is shown on the plots by white crosses. On 07 May 2003 ducts occurred at two heights simultaneously.