Meteorological observations can sometimes be performed when there is no rain present. The figure on the left shows data taken on 21 April 1998, at 14:03. The radar observes cloud between 3 and 8 km showing that although the frequency is low for cloud measurements, the antenna gain is large, making this a good cloud radar system.
At ranges out to about 30 km there is a layer around 1km altitude which is likely to represent the top of the boundary layer. A similar effect was seen at a different azimuth a few minutes earlier.
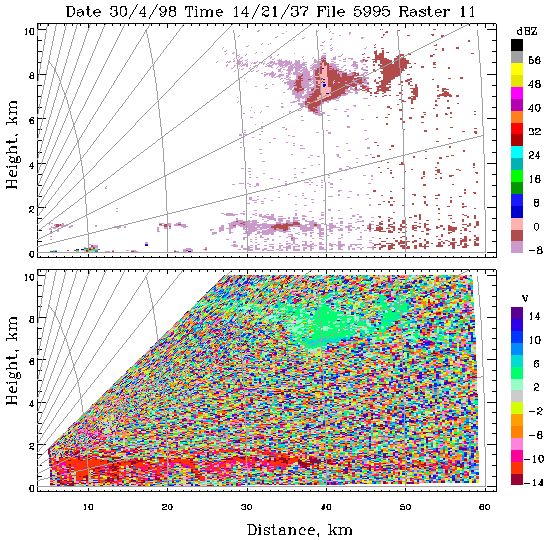
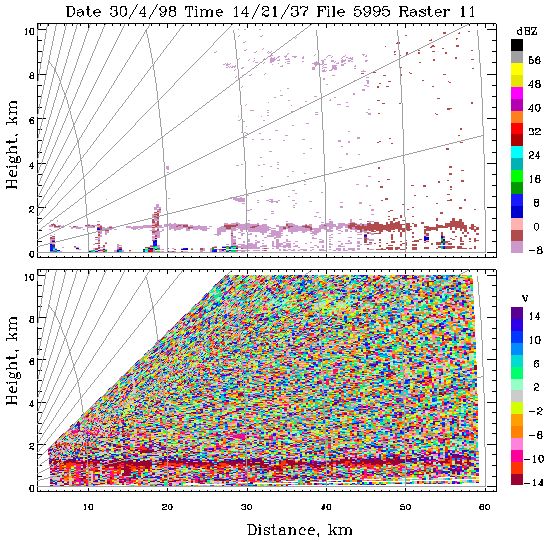
The following two figures show observations from 30 April 1998 at an azimuth of 170 degrees(left) and 200 degrees (right) at 14:21 in the afternoon (click to enlarge images). During the early afternoon there was a strong boundary layer echo at 1 km height, which was also seen in data from the infra red ceilometer. At higher altitudes, there were cirrus clouds at 8 km.
In the final figure below (click to enlarge), later in the afternoon, at 17:54 on azimuth 265, the cirrus has increased in intensity, while the boundary layer echo has virtually disappeared. Sensitivity is important for these weak signals but it is not possible to increase the pulse length to transmit more mean power as the pulse length is fixed.
An alternative is increased integration. Increasing incoherent integration by a factor of 10 from the normal 64 pulses of each polarisation, up to 640 pulses gives a theoretical gain of 5 dB. There is a trade-off between integration and the need to scan. Slow scans have been used and the minimum is 0.1 degrees/s. Coherent integration would theoretically give even greater gains.
In other parts of the world, these observations are often carried out using help from insects. These act as a tracer, giving a stronger echo but the effect is much reduced in the UK. The temperature needs to be around 10 0C and there are different populations at different altitudes.
Scanning the boundary layer on summer days may show convective bulges at the top of the boundary layer, indicating the position of showers which is an extremely difficult effect to predict using meteorological models.